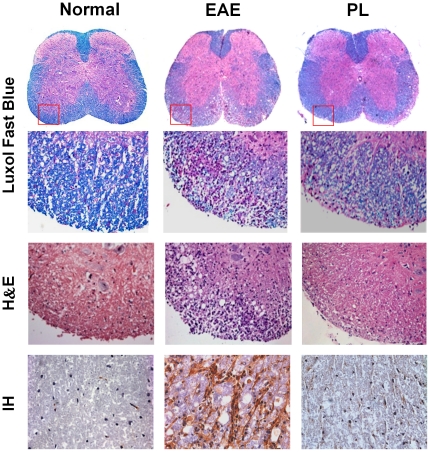
Figure 3. Histology and immunohistochemical staining of spinal cord tissue.
Spinal cord sections obtained from normal control mice, EAE mice or PL-treated mice at day 18 postimmunization (treatment protocol) were analyzed by Luxol Fast Blue staining for demyelination, H&E staining for inflammation, and Immunohistochemical staining (IH) for CD4+ T cell infiltration. ×25 or ×400. Data presented are representative of three independent experiments. CD4+ T cell infiltrates stained by immunohistochemistry were enumerated microscopically in normal mice (10.33±3.51), EAE mice (128.67±7.02) and PL-treated mice (34.33±3.51), respectively. Data are expressed as mean ± SD. p<0.001 for EAE mice versus normal mice, p<0.01 for PL-treated mice versus EAE mice.

