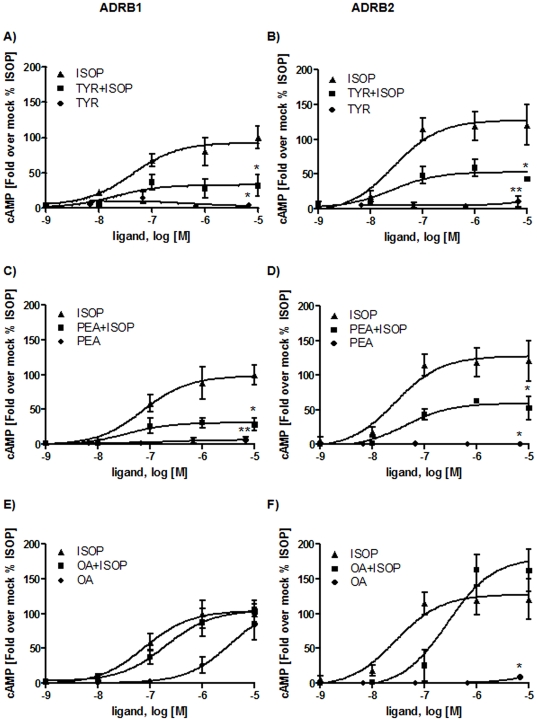
Figure 3. Characterization of hADRB1 and hADRB2 after trace amine challenge.
HEK293 cells were transiently transfected with hADRB1 and hADRB2, respectively. Cells were pre-incubated with increasing concentrations of the trace amines TYR, PEA or OA (6.7 nM to 6700 nM) for 15 minutes. For competition studies ISOP with increasing concentrations (10000 nM to 1 nM) was added and incubated for additional 30 minutes. As controls hADRB1 and hADRB2 were incubated with each substance alone with the same concentration for 45 minutes. Three to four independent experiments measured in duplex or tripletts mean ± SEM are depicted here. Fold over mock was calculated and expressed as percentage of ISOP stimulation (100%). Maximal values were statistically analyzed using paired one-tail t-test compared to ISOP maximal stimulation. A-B) hADRB1 and hADRB2 were stimulated with ISOP and TYR alone and with both substances simultaneously. TYR shows no agonistic effect on hADRB1 (p<0.05) and hADRB2 (p<0.01), but acts as an allosteric antagonist on hADRB1/2, indicated by a decreased maximum of stimulation (p<0.05) with comparable EC50 values. C-D) PEA shows no agonistic effects on both hADRB1 (p<0.01) and hADRB2 (p<0.05) but leads to a decreased maximum of stimulation by ISOP when pre-incubated with PEA (p<0.05). The EC50 value is similar to stimulation with ISOP alone. E) OA acts as an agonist on hADRB1 but with a decreased efficacy. Simultaneous incubation with ISOP and OA reveals no antagonistic effect of OA on hADRB1 (table 1). F) OA is an orthosteric antagonist on hADRB2, indicated by a right shift of the EC50 value. OA however showed no agonistic effect on hADRB2 (p<0.05).

