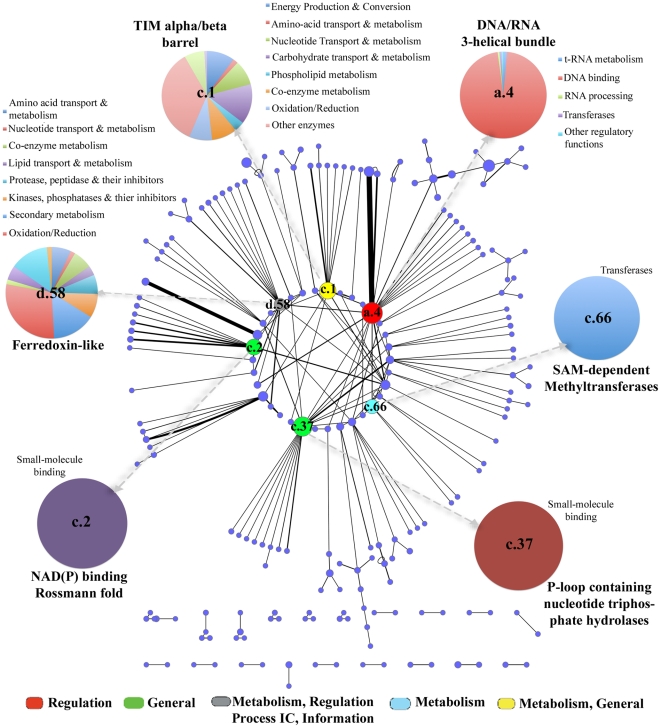
Figure 3. Fold combinations observed in modeled proteome.
A weighted undirected network representing fold associations in the modeled part of the TB proteome. Each node (circle) represents a fold which is weighted based on the frequency of occurrence in the modeled proteome whereas an edge (line) represents the co-occurrence of those fold types in various proteins. The thicker the edge, the more number of times the pair of domains co-occur. The coloring scheme is based on the function assignment for topmost occurring folds (as indicated in the color key). Distribution of super-families in each of the 5 topmost occurring folds are also shown as labeled pie-charts.

