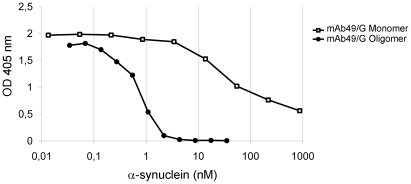
Figure 1. Characterization of mAb49/G by inhibition ELISA.
Binding of mAb49/G to α-synuclein monomers (□) or α-synuclein oligomers (•) was analyzed on HNE stabilized α-synuclein oligomer coated plates. On the x-axis, the molar concentration of α-synuclein is displayed. The IC50 values are calculated as the concentration of either α-synuclein monomers or α-synuclein oligomers needed to quench half of the signal in the ELISA. Note that, due to uncertainties concerning the size of the α-synuclein oligomers used in this assay, the concentration in pM for both species is based on the molecular weight of one α-synuclein monomer. These data are representative of at least three independent experiments.

