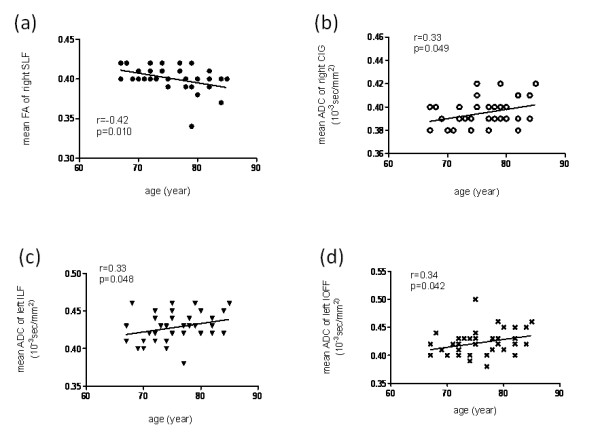
Figure 3.

Scatter plots and linear regression of age against (a) the mean FA of the right SLF, (b) the mean ADC of the right CIG, (c) the mean ADC of the left ILF and (d) the mean ADC of the left IOFF. The correlation coefficients (r) and the p-values are shown. FA, fractional anisotropy; SLF, superior longitudinal fasciculus; ADC, apparent diffusion coefficient (10-3 s/mm2); CIG, cingulate fasciculus; ILF, inferior longitudinal fasciculus; IOFF, inferior occipitofrontal fasciculus.
