
Figure 3.
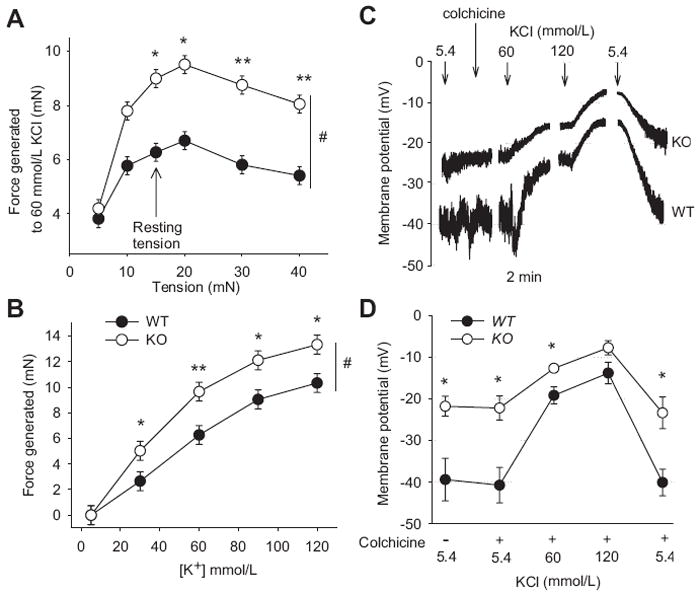
(A) Force generated by addition of 60 mmol/L KCl at different resting tensions in thoracic aortas. (B) Concentration response curves for KCl at a resting force of 15 mN. (C) Raw traces of membrane potential, as measured by current clamp, in response to KCl in aortic VSMC from KO (upper trace) versus WT (lower trace). (D) Summary data from membrane potential studies. n=5-8 for each experimental group. #p<0.05 using 2-way RM-ANOVA, *p<0.05 and **p<0.01 using the Holm-Sidak method for multiple comparison.