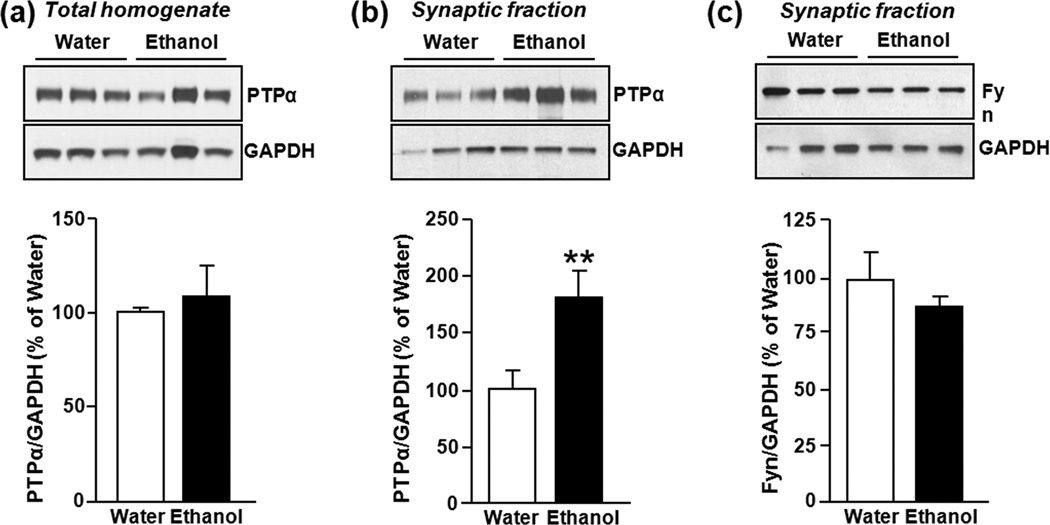
Figure 3. Binge drinking of ethanol increases protein levels of PTPα in synaptic membranes in the DMS of Long Evans rats.
Rats underwent an intermittent access to 20% ethanol in a 2-bottle choice paradigm for 7–8 weeks. Thirty minutes after the initiation of the last drinking session, DMS tissue was dissected and protein levels of PTPα in homogenates (a), and synaptic membranes (b) as well as the level of Fyn in the synaptosomal fraction were measured. (a) Image is representative of n=9 (water), n=9 (ethanol). (b) Images are representative of n=8 (water), n=6 (ethanol). (c) Image is representative of n=3 (water), n=3 (ethanol). Bar graphs summarize the averaged changes in protein levels of PTPα in total homogenates (a), as well as PTPα (b) and Fyn (c) in the synaptosomal fraction. Band intensity of PTPα or Fyn was normalized to the level of GAPDH and plotted as percentage of water-only drinking rats. Results are expressed as mean ± SEM. **P < 0.01 vs. water (two-tailed Student’s t-test).

