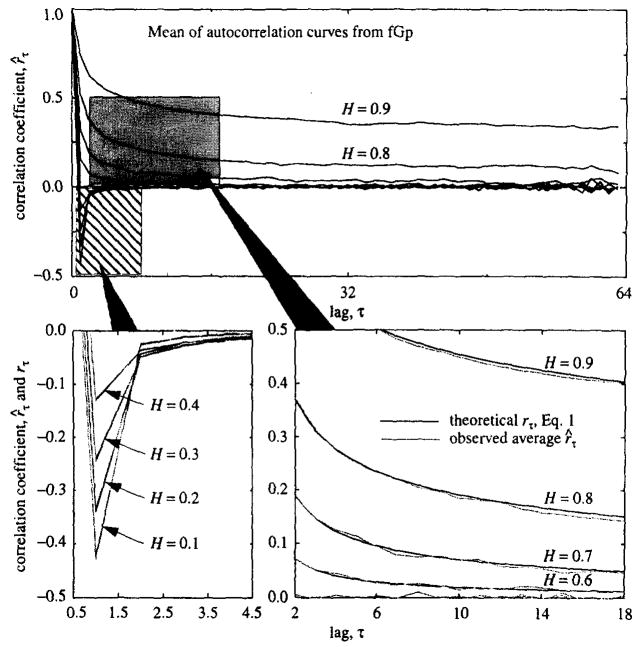
Fig. 2.
Mean autocorrelation function r̂τ, for 1000 simulations of fGn of length N = 64 from the fGp algorithm with H = 0.1,0.2,…, 0.9 (upper panel). Lower left panel: Expanded view of the striped box in the upper panel: theoretical (rτ, solid lines) and observed mean (r̂τ, shaded lines) autocorrelation functions for H = 0.1,…,0.4 for 1 ≤ τ ≤4. Right lower panel: Expanded view of the shaded box in the upper panel: rτ, and r̂ for H = 0.6, …, 0.9 for 2≤ τ≤18.

