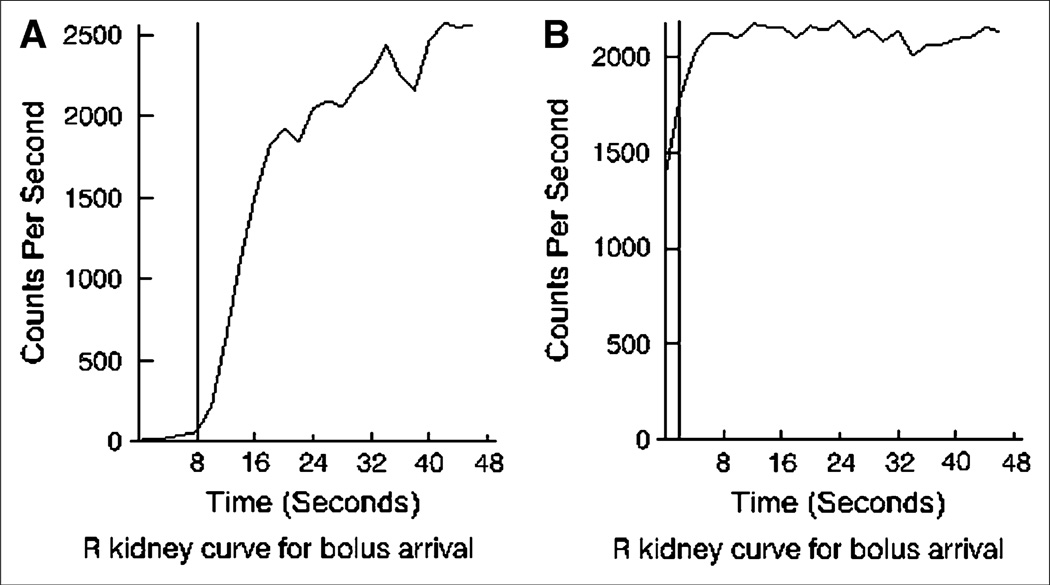
FIGURE 3.
Early phase of renogram curve, indicating arrival of radiopharmaceutical bolus in kidneys. (A) In usual case, a fit to upslope of curve is extrapolated to x-axis, and this intercept identifies bolus arrival (vertical line). (B) If camera acquisition was started too late, earliest part of uptake phase will be missing, and bolus arrival cannot be identified with certainty. A default early frame (vertical line) is used in calculations, but accuracy is reduced.

