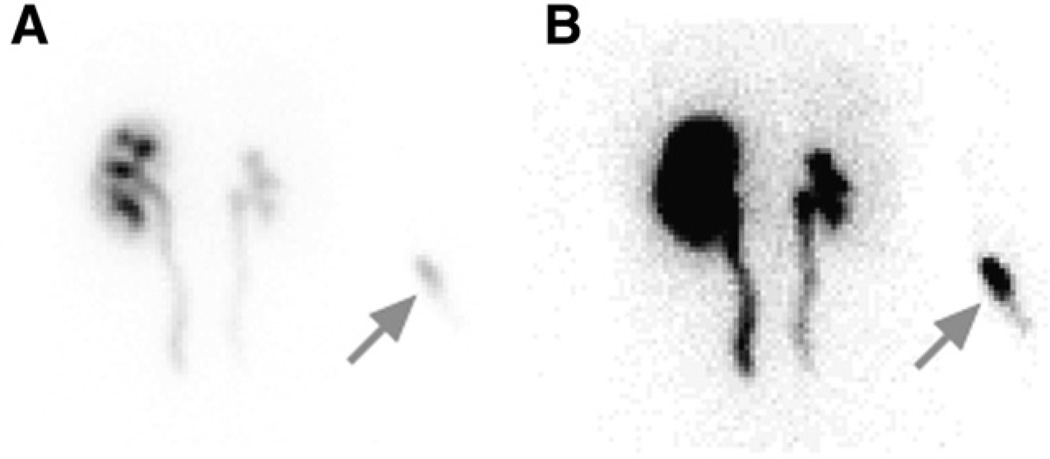
FIGURE 5.
Posterior injection site image from patient determined to have significant infiltration (>1% of injected dose; arrows). (A) Image displayed at default window level, which is scaled to counts in kidney. (B) Window level adjusted to show body outline and to better show injection site in right arm.

