Figure 7.
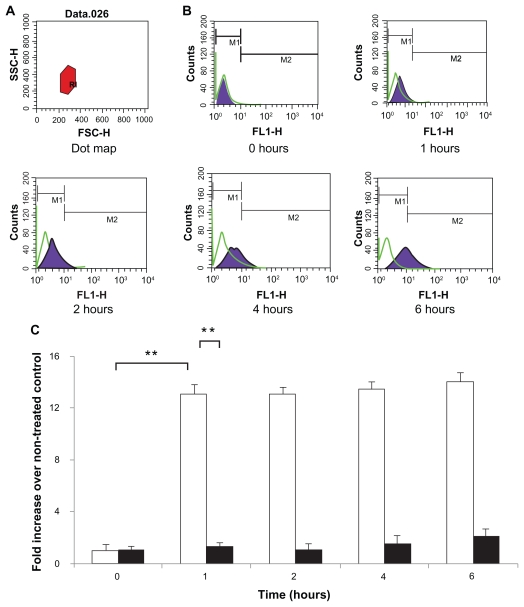
Caco-2 cell uptake profiles of FITC-BSA-loaded lipoparticles (blank) and liposomes (black). Data represents mean ± S D, n = 3. (A) Forward and side light scatter was used to gate the desired scattering events (normal cells) from dead cells and cell debris. (B) Uptake of FITC-BSA-loaded PEGylated liposomes and lipoparticles into Caco-2 cells. Cells were analyzed with 488 nm excitation and 522 nm band-pass filters in the emission path. (C) Fluorescence intensity of FITC-BSA-loaded liposome and lipoparticle preparations in normal cells expressed as the intensity ratio by dividing by the untreated control.
Notes: Data are expressed as mean ± SD, n = 3 (student’s t-test; ** P < 0.01).
Abbreviations: FITC-BSA, fluorescein isothiocyanate-conjugated bovine serum albumin; SD, standard deviation.

