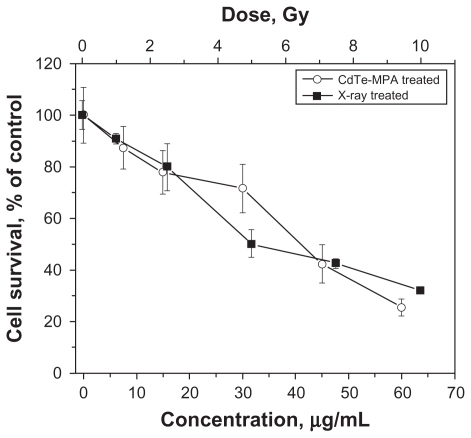
Figure 3.
Viability of FEMX-I cells after different treatments: irradiated with different doses of 160 kV X-rays (curve with black quadrates) and incubated with different concentrations of the CdTe-MPA quantum dots for 24 hours (curve with white circles). The viability was calculated as a percentage of the number of the treated cells relative to the number of the control untreated cells. The results are means ± standard deviation from three independent experiments.

