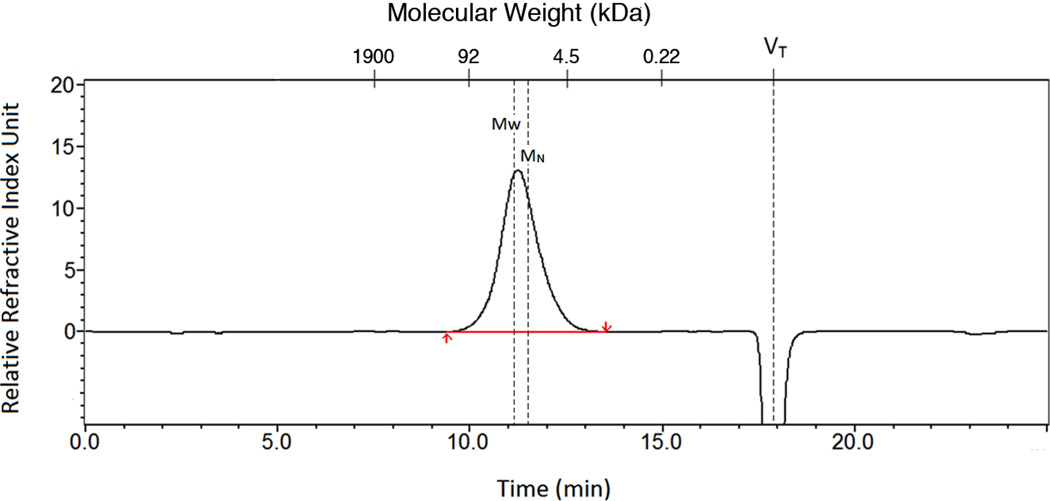
Figure 2.
A sample chromatogram using SEC for heparin molecular weight determination of heparin #1. The y-axis corresponds to the mass detected using a refractive index detector and the x-axes correspond to elution time (min) and molecular mass (calculated from a standard curve). VT marks the total volume of the column where a change in salt concentration results in a negative peak.

