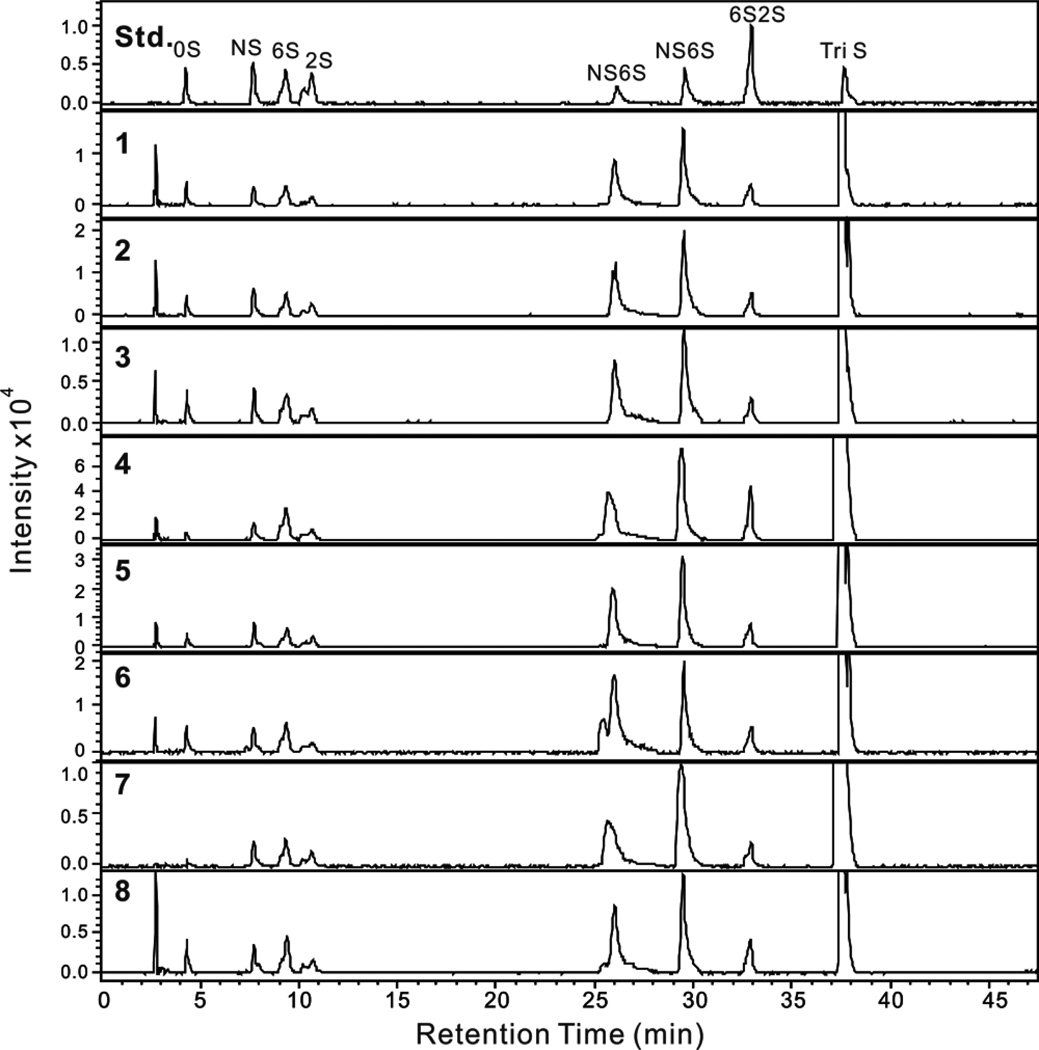
Figure 3.
EIC of disaccharide analysis of 7 heparin samples and one LMWH sample by RPIP-UPLC-MS. Std shows the analysis of an equimolar mixture of 8 disaccharide standards used for peak identification and injection of different amounts afford a standard curve for quantification. Chromatograms 1–8 show the disaccharide analysis of the eight commercial heparin samples #1–#8, respectively. The peak eluting prior to 0S in each chromatogram is salt.

