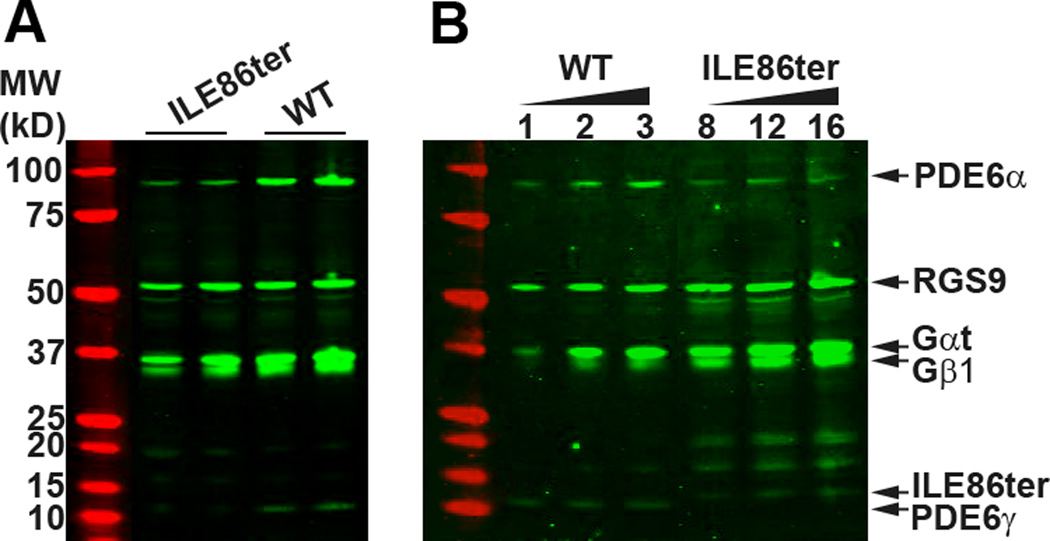
Fig. 1. Immunoblot analysis of the expression of PDE and other rod transduction proteins.
(A). The levels of RGS9, Gαt and Gβ1 were comparable between WT and ILE86ter retinas. However, PDE6 α and γ subunits were noticeably lowered in the ILE86ter retinas. Equal fraction of a retina (1/50) from an individual mouse was loaded onto each lane. (B). Quantification of PDE expression levels in ILE86ter and WT retinas. Representative blot of retinal extract prepared from WT and ILE86TER/GCAPs−/− mice. Each lane represent the amount loaded (µl) per retina (200 µl total sample volume). Based on the fluorescence signal quantified from each sample, the amount of PDE6α and PDE6γ in ILE86ter was 10 ± 3% of WT (N=3). Control experiments revealed no difference in PDE6 subunit expression levels between ILE86TER and ILE86TER/GCAPs−/− mice. Levels of other transduction proteins (RGS9, Gαt and Gβ1) were similar between WT and ILE86ter.

