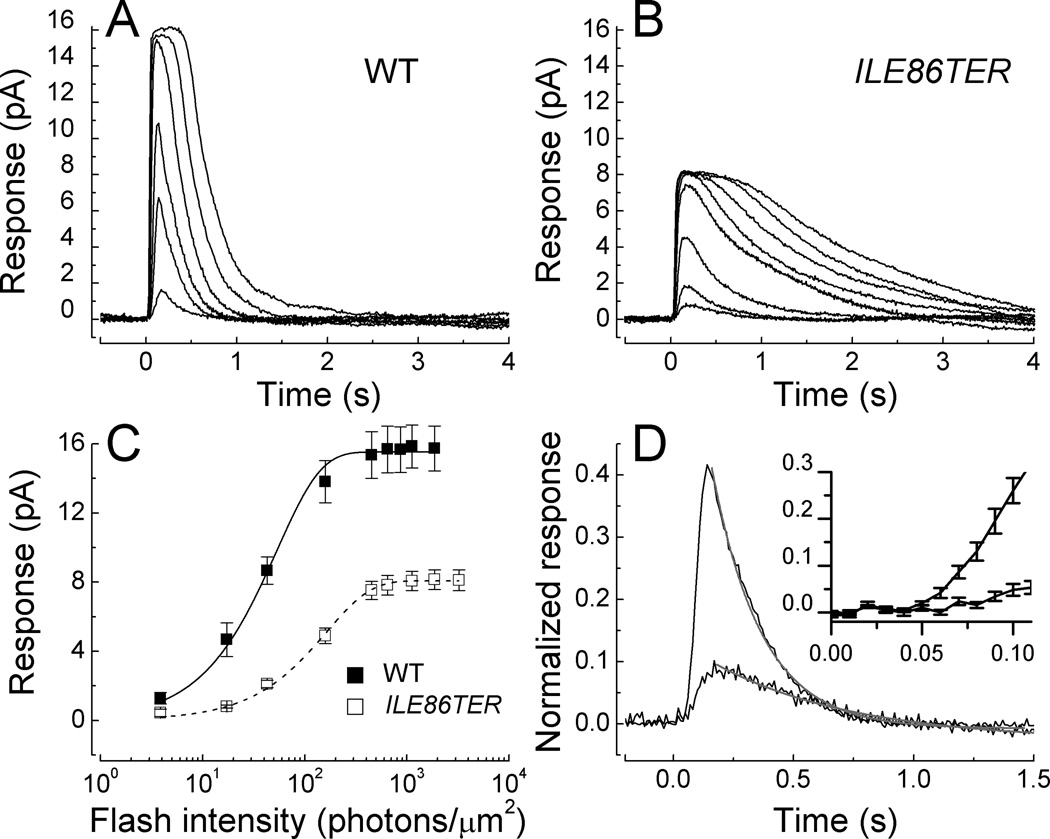
Fig. 3. Waveform and amplitude of WT and ILE86TER rods.
(A). Mean responses averaged from 10 WT rods to responses of 20 ms flashes of the following intensities (in photons µm−2): 3.9, 17, 43, 159, 453, and 1120. (B). Mean responses averaged from 18 ILE86TER rods to responses of 20 ms flashes of the following intensities (in photons µm2): 17, 43, 159, 453, 646, 1120, 1870, and 3250. (C). Peak amplitude of responses with SE as a function of intensity from 10 WT rods and 18 ILE86TER rods; same rods as in Figs. 3A and 3B. Means have been fitted with the exponential saturation function [46] of the form r = rmax [1 − exp(−kI)] where r is the peak amplitude of the response, rmax is the maximum value of the peak response amplitude at bright flash intensities, I is the flash intensity, and k is a constant. Best-fitting values were k = 0.019 photons−1 µm2 and rmax of 15.5 pA for WT rods, and k = 0.006 photons−1 µm2 and rmax of 8.1 pA for ILE86TER rods. (D). Mean responses from the same rods as in Figs. 3A and 3B to the same flash of intensity 17 photons µm−2. Declining waveforms of responses have been fitted with Equation (1); see text. Insert. Initial time courses of responses (with SE) are given on a faster time base to illustrate much slower rate of rise of ILE86TER response.

