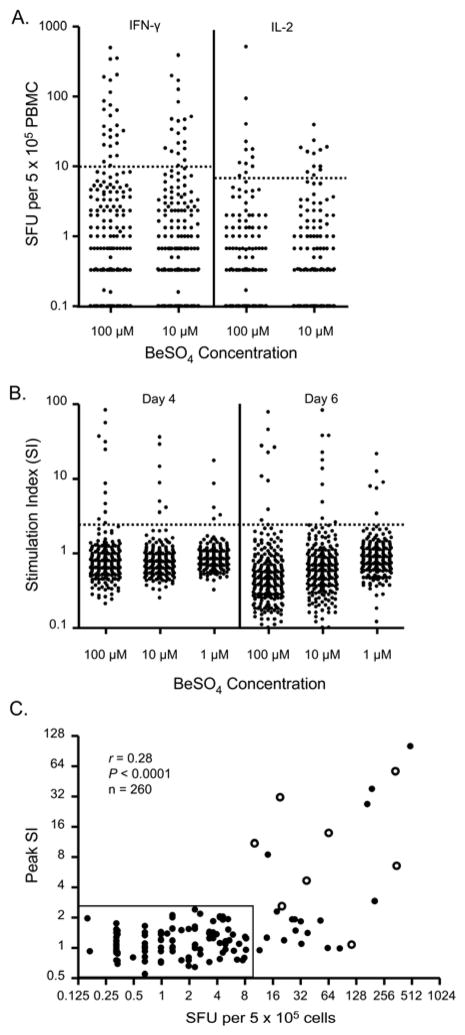
Figure 2.
Identification of a Be-induced adaptive immune response. A, Frequency of Be-specific T cells in blood using IFN-γ and IL-2 ELISPOT. Data are expressed as the mean SFU for each subject. Cytokine values above the dotted line represent a positive cytokine response. B, Be-induced proliferative response. A stimulation index indicative of a positive response is defined as ≥2.5 (dotted line). C, Correlation between the number of Be-responsive T cells in blood and peak SI. Subjects with confirmed CBD upon clinical evaluation are shown as open circles. Rectangle surrounds subjects with a negative IFN-γ ELISPOT and BeLPT.

