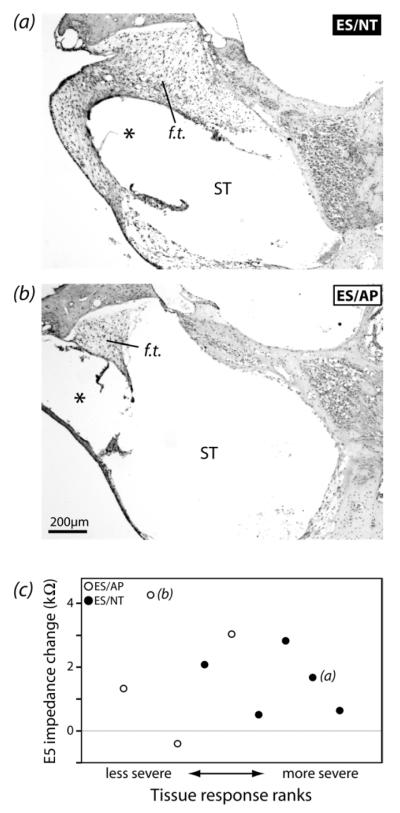
Figure 7.
(a) Representative examples of the fibrous tissue response (f.t.) in lower turn 1 scala tympani (ST) of ES/NT and ES/AP cochleae. ES/NT cochleae appeared to have a more extensive tissue reaction in the ST than ES/AP. The * show the likely chronic locations of the implants. (b) Qualitative ranks for tissue response severity plotted against the change in impedance from post-implantation to day 28 for E5 (electrode near cochlear region examined). There was no significant relationship between impedance change and rank across all ES animals or within either ES/AP or ES/NT groups (Spearman’s rho, p > 0.05). The letters in c indicate the data points for the micrographs in a and b.

