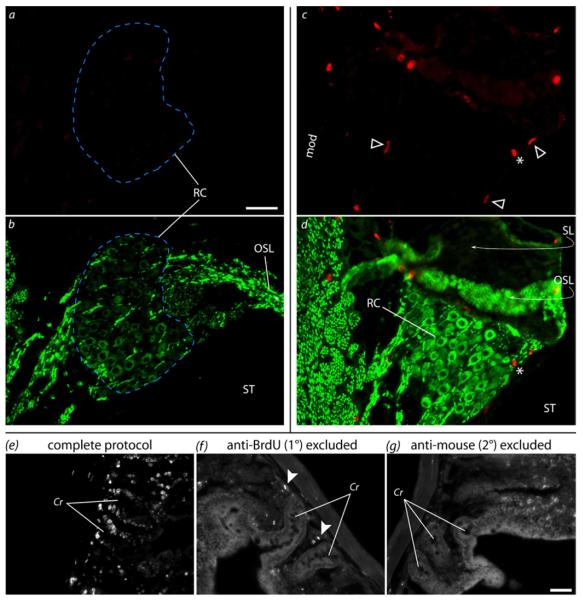
Figure 8.
Immunodetection of BrdU in cochlear and control tissue. (a,b) Representative example showing the lack of BrdU labeling in Rosenthal’s canal (RC; blue dashed line) of an ES/NT cochlea. (a) BrdU (red) and (b) neurofilament (green) in upper turn 1. SGN somata can be seen in the neurofilament channel, but no BrdU labeling was seen in SGN nuclei. (c,d) In one ES/NT cochlea, positive BrdU labeling was seen in what appear to be Schwann cell nuclei (arrowheads) in the modiolus (mod, not shown) and RC . An intense globular object (*) that was likely artifactual – possibly non-specific secondary antibody binding as was seen in negative controls (arrowheads in f) – can also be seen. No BrdU-labeled nuclei in cochlear tissue were surrounded by a neurofilament-labeled soma. The peripheral structures (i.e. OSL and SL) in c-d can be seen to be detached from the slide and folded back (curved arrows), obscuring part of RC. This illustrates the difficulties the DNA denaturation steps can create for analysis of sectioned cochlear tissue. (e-g) Positive and negative BrdU labeling controls (gut tissue). The complete labeling protocol (e) yielded positive labeling (white) in stem cell nuclei in the intestinal crypts (Cr), whereas exclusion of primary (f) or secondary antibodies (g) did not result in labeling. The image brightness has been increased in f and g to better view the gut anatomy. OSL = osseous spiral lamina, SL = spiral limbus, ST = scala tympani. Scale bars = 50μm (same scale a-d and e-g).

