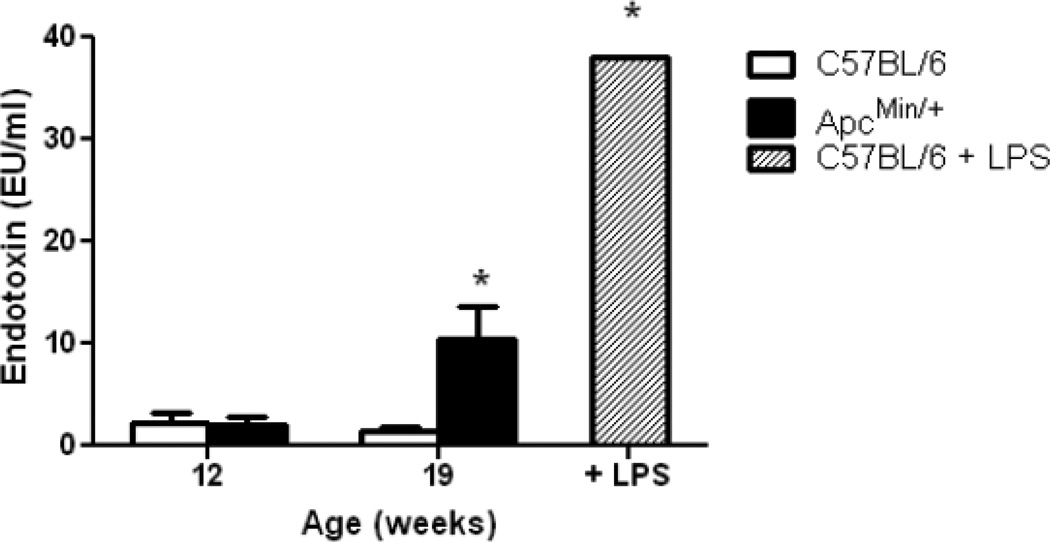
Figure 3. Plasma endotoxin concentration increases during development of cachexia in ApcMin/+ mice.
N = 7–9 per group. Right hand bar represents plasma endotoxin concentration in C57BL/6 mice at 12 hr after intraperitoneal injection of 250µg of endotoxin (N = 2). Data are means ± SE. * p<0.05. vs. all other groups.

