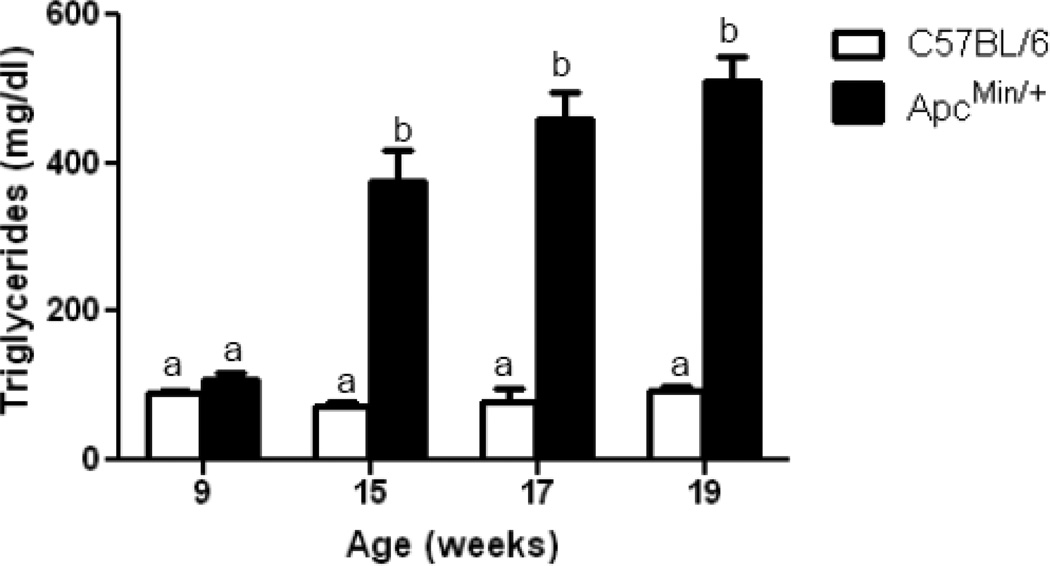
Figure 6. Plasma triglyceride concentration increases during development of cachexia in the ApcMin/+ mouse.
Plasma triglyceride concentration was measured in the same animals over time, N = 7–9. Data are expressed as means ± SE. bp<.05 indicates significant difference from controls and ApcMin/+ at 9 weeks.

