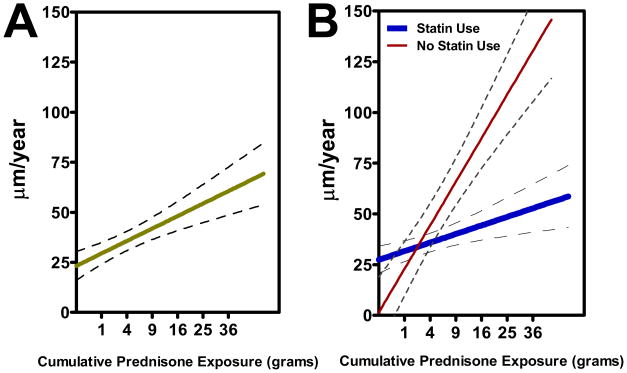
Figure 2. Adjusted associations of cumulative prednisone exposure (grams)with the yearly change in maximum intima-medial thickness of the internal carotid artery (μm per year).
Graphs depict the least squares estimator for the linear association and the 95% confidence interval around the point estimate. Cumulative prednisoneis depicted on the quadratic scale. Panel A depicts the unstratified association, adjusted for exercise, ever smoking, and body surface area [β = 1.26 (95% CI 0.07, 2.44)]. Panel B depicts the association stratified on statin use at baseline, adjusted for the same covariates as above [β = 0.85 (95% CI −0.53, 2.23) for statin use and β = 3.93 (95% CI 1.41, 6.45) for no statin use; p-value for test of interaction = 0.036]

