
Fig. 3.
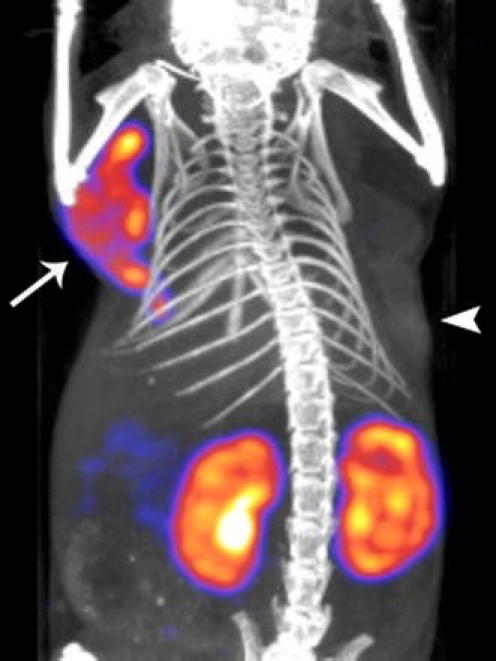
Representative animal SPECT/CT image showing biodistribution of 111In-DOTA-sCCK8[Phe2(p-CH2SO3H), HPG3,6] at 1 h after administration. Radiotracer uptake is clearly visible in the CCK2R-transfected A431 tumor (left shoulder, arrow) and kidneys, whereas no uptake is noted in the mock-transfected A431 tumor (right flank, arrow head)