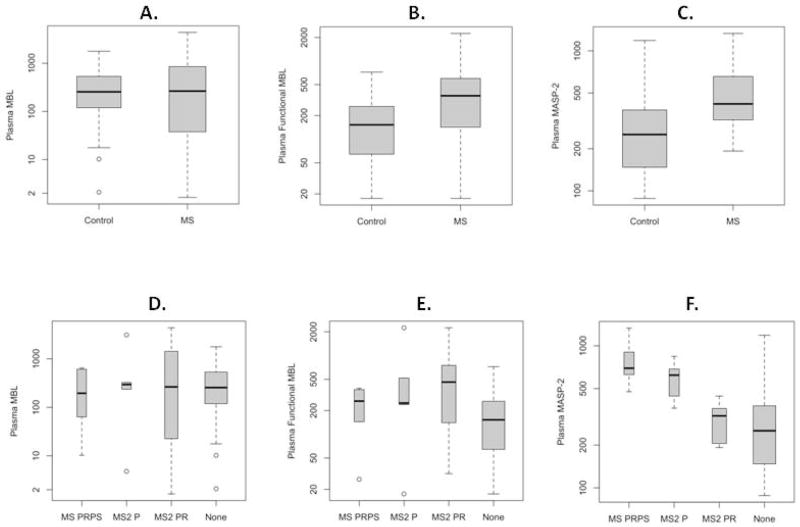
Figure 1. Comparison of plasma levels of total MBL (ng/ml), MASP-2 (ng/ml), and functional MBL (U/ml), on logarithmic scale, between the MS and non-MS groups using Wilcoxon rank-sum test.
Dark middle line represents the median value, the box includes the middle 50% of the data, and the “whiskers” extend to the middle 95% of the data. Total MBL levels in plasma did not differ in MS vs. non-MS (control) samples while there were significantly higher levels of functional MBL and MASP-2 in MS vs. control samples. When analyzed by MS subtypes, levels of total MBL in plasma did not differ in MS progressive, relapsing and progressive or MS relapsing/remitting (MS2 PRPS) disease, MS secondary progressive (MS2 P), or MS secondary progressive with relapse (MS2 PR) disease compared to MS negative control samples (none) (D). However, functional MBL (E) and MASP-2 (F) were significantly higher in MS subtypes than the MS negative controls (none) (see text for details).

