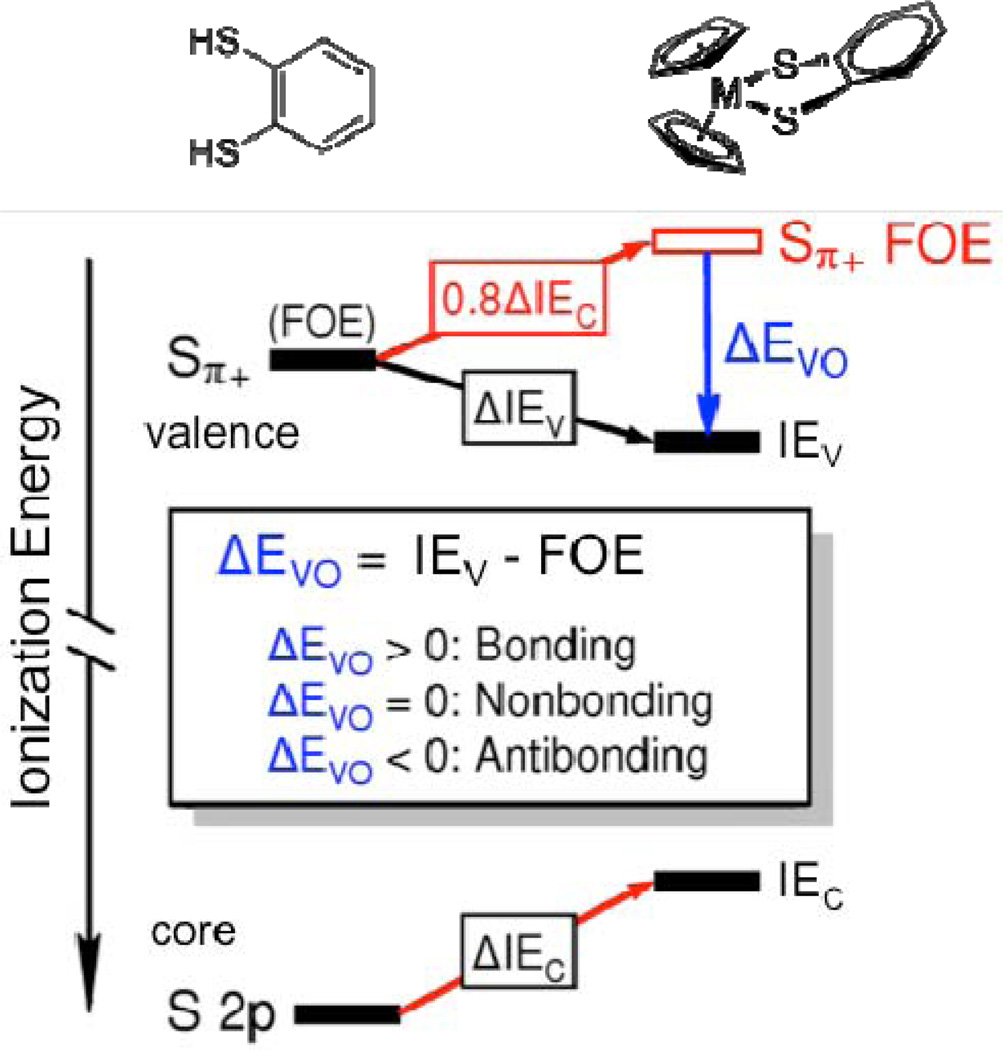
Figure 3.
A schematic depiction of the Sπ+ orbital interaction energies. The black bars are the experimentally measured ionization energies of the valence (IEV) and core (IEC) orbitals with the observed valence and core ionization shifts between the two molecules given by ΔIEV and ΔIEC, respectively. For H2bdt (shown on the left) the valence ionization energy is the same as the Sπ+ fragment orbital energy (FOE) because there is no overlap of this orbital with the H atom orbitals. For Cp2M(bdt) (shown on the right) the fragment orbital energies are shifted due to the change in charge potential (depicted by the red arrows). The valence ionization shift due to the change in charge potential is approximately 0.8 times core ionization energy shift ΔIEC between the two molecules. Deviation of the observed valence ionization energy from the projected Sπ+ fragment orbital energy is the shift in energy due to valence orbital overlap, ΔEVO. This figure depicts a bonding interaction in which the valence ionization energy IEV is stabilized by orbital overlap interaction compared to the projected Sπ+ FOE, which yields a ΔEVO > 0.

