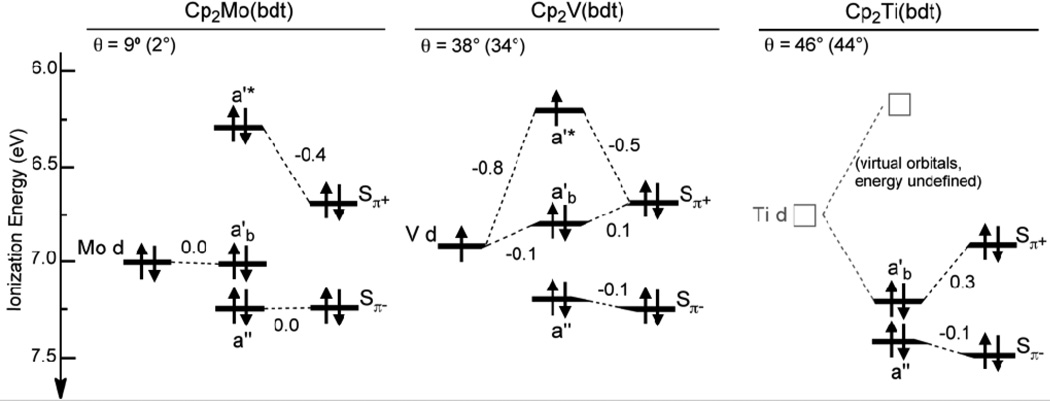
Figure 6.
Summary of the molecular ionization energies measured by gas-phase photoelectron spectroscopy (indicated by the orbital symmetry labels) and the bent-metallocene and bdt fragment orbital energies obtained by the core/valence ionization correlation model (indicated by the metal d and Sπ± labels). The angles θ are the fold angles as measured from crystal structures (values optimized from gas-phase calculations in parentheses).

