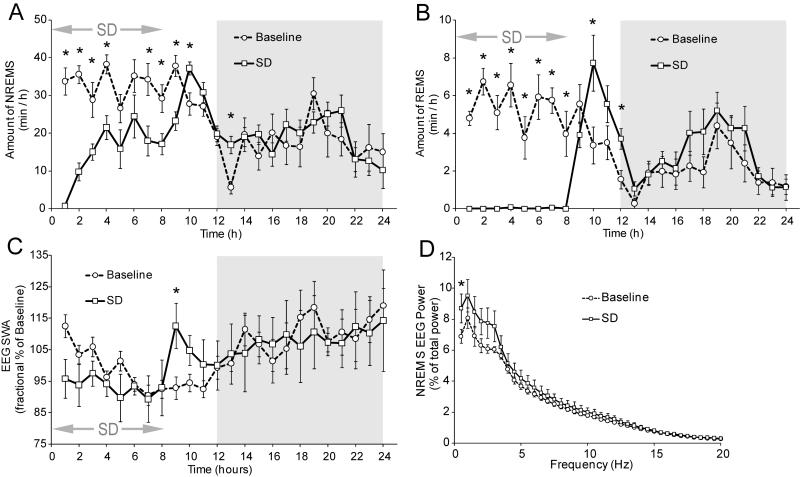
Figure 2.
A, NREM sleep for 24 h including the SD period (arrows) in 1 h bins. Shaded area is the dark period. B, REM sleep for 24 h including the SD period in 1 h bins. C, NREM sleep delta power for 24 h including the SD period in 1 h bins. D, NREM sleep power spectra for the first h after SD (time bin 9). Error bars ±SEM. * denotes p<0.05

