Figure 3.
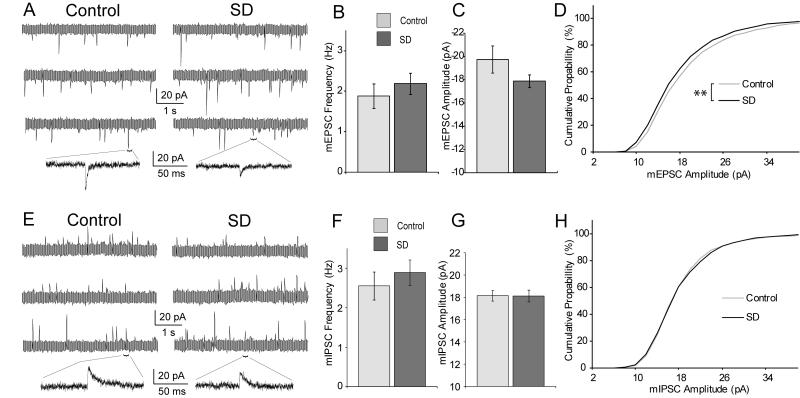
Synaptic effects of SD. A, Example traces for mEPSCs with and without SD (3 cells each) and enlarged regions below to show single events. Note that noise levels appear larger in highly compressed sweeps. B, Average mEPSC frequency. C, Average mEPSC amplitude. D, Cumulative probability distribution of mEPSCs. E, Example traces for mIPSCs with and without SD. F, Average mIPSC frequency. G, Average mIPSC amplitude. H, Cumulative probability distribution of mIPSCs. Error bars ±SEM. ** denotes p<0.01

