Figure 2.
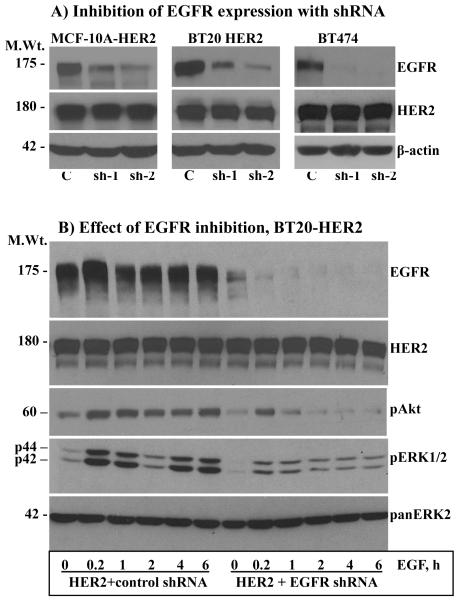
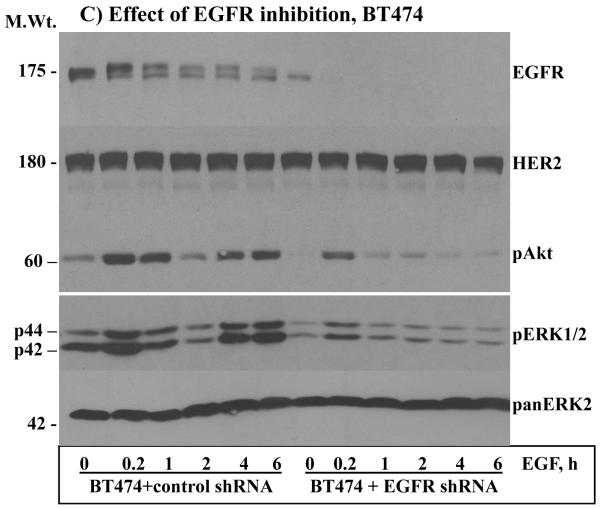
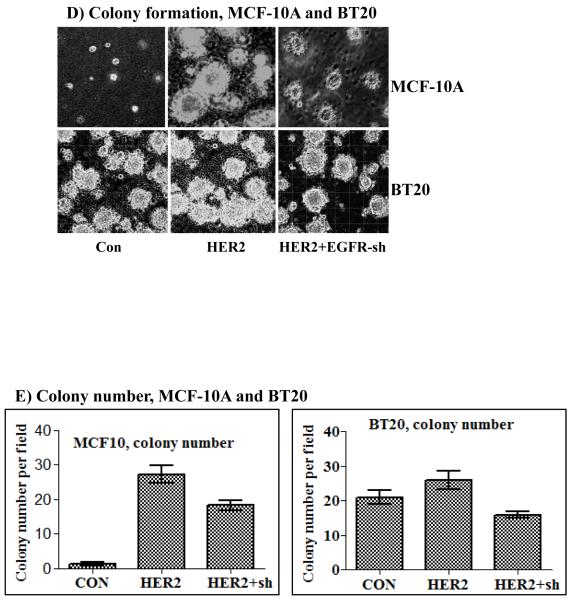
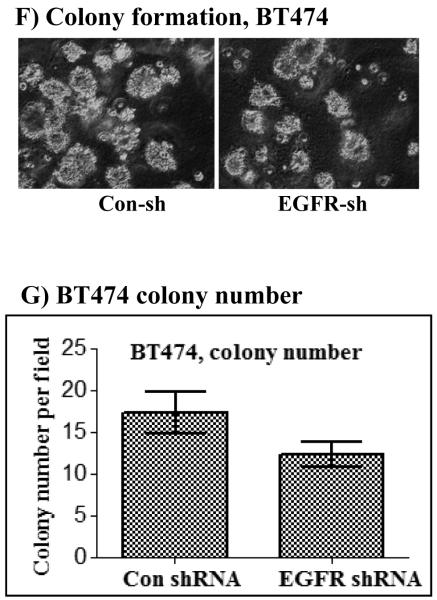
A) Inhibition of EGFR expression by stable expression of anti-EGFR shRNA. Both shRNA-1 (sh-1) and shRNA-2 (sh-2) suppressed EGFR expression efficiently without affecting HER2 expression in all three cell lines. Effect of EGFR inhibition on EGF-induced ERK1/2 and Akt activation in the BT20-HER2 (B) and the BT474 (C) cell lines. D) Effect of EGFR inhibition on colony formation in soft agar by the MCF-10A-HER2 and the BT20-HER2 cell lines. E) Bar graphs showing colony number formed by the control, the HER2 and the HER2 plus EGFR shRNA cells. F) Effect of EGFR inhibition on colony formation by the BT474 cell line. G) Bar graph showing colony number formed by the control and the EGFR shRNA cells derived from the BT474 cell line. All of the bar graphs represent mean ± standard deviation from three independent experiments. Abbreviations; C: control; sh-1: shRNA-1; sh-2: shRNA-2.


