Figure 4.
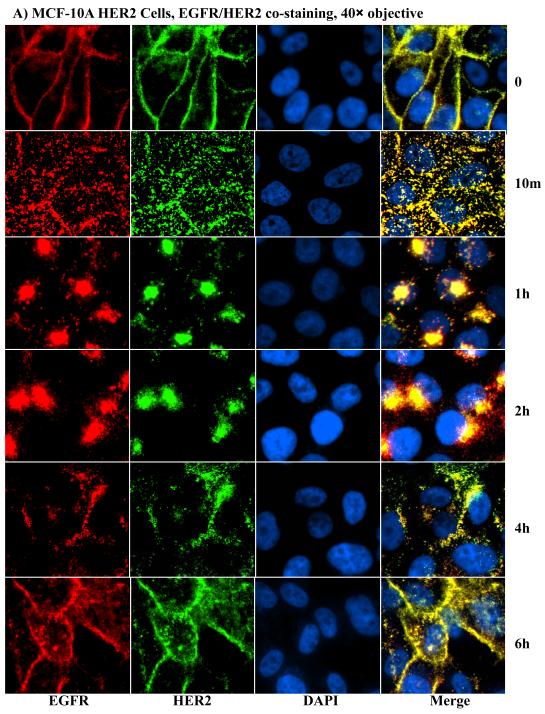
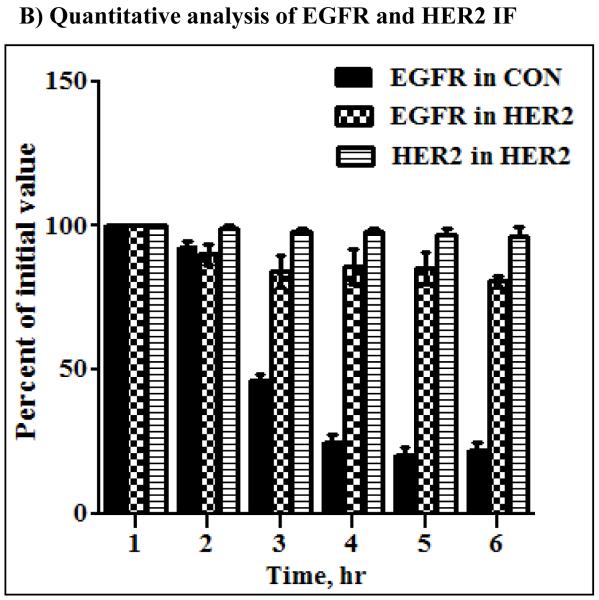
A) Anti-EGFR and anti-HER2 immunofluorescence microscopy of the HER2 cells derived from the MCF-10A. Notable findings were efficient internalization of both EGFR and HER2, co-localization of EGFR and HER2, and reappearance of both proteins at the plasma membrane within 4 – 6 hours. B) Fluorescence intensity measurements of EGFR in the control and HER2 cells as well as HER2 in the HER2 cells of MCF10A origin. The bar graph represents mean ± standard deviation from three independent experiments.


