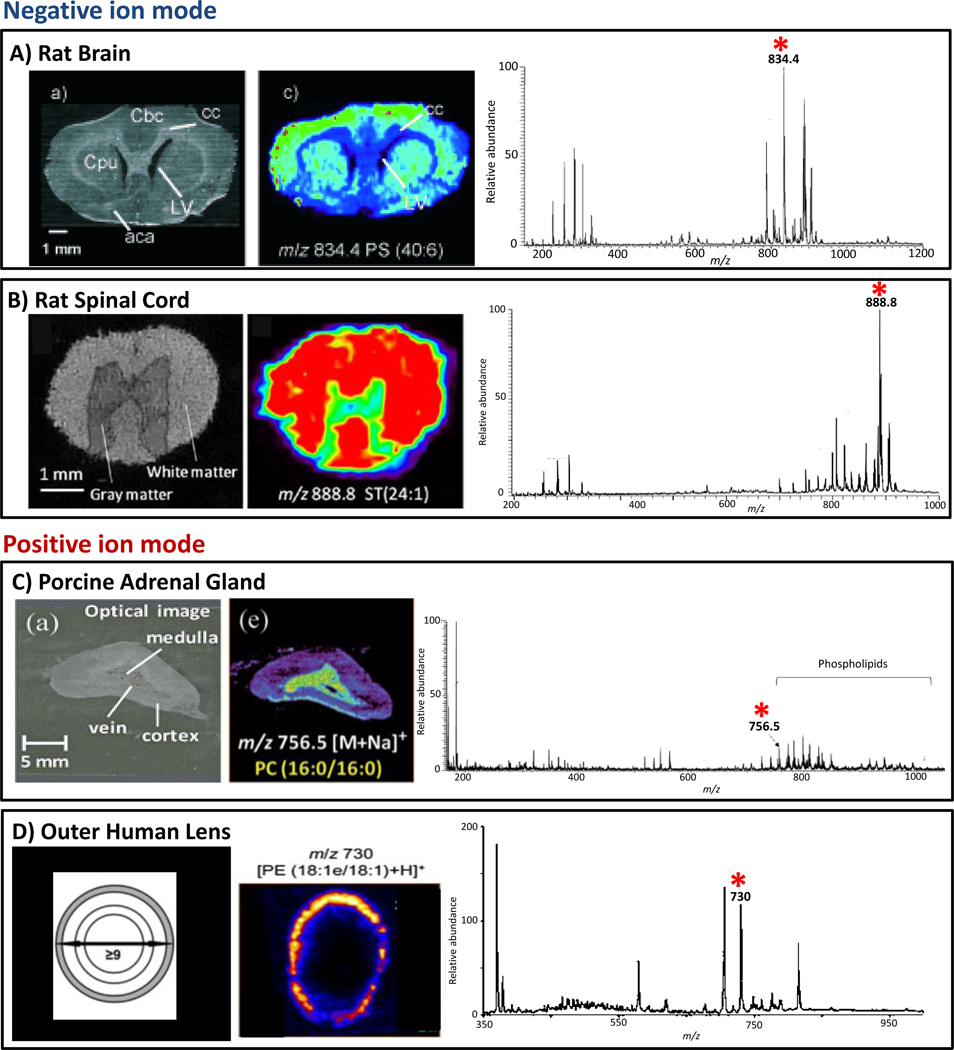
Fig. 8.
Tissue characterization by DESI-MS imaging. (A) Optical image of rat brain; DESI-MS ion image of PS(40:6), m/z 834.4, acquired at unit resolution in negative ion mode; representative negative ion mode DESI-MS mass spectrum from rat brain with the peak corresponding to PS(40:6) starred. (B) Optical image of rat spinal cord; DESI-MS ion image of ST(24:1), m/z 888.8, acquired at unit resolution in negative ion mode; representative negative ion mode DESI-MS mass spectrum from rat spinal cord with the peak corresponding to ST(24:1) starred. (C) Optical image of porcine adrenal gland; DESI-MS ion image of PC(16:0/16:0), m/z 756.6, acquired at unit resolution in positive ion mode; representative positive ion mode DESI-MS mass spectrum from porcine adrenal gland with the peak corresponding to PC(16:0/16:0) starred. (D) Schematic showing the delineations used to select regions of the human lens, the outer region is marked in grey; DESI-MS ion image of PE(18:1e/18:1), m/z 730 acquired at unit resolution in the positive ion mode; representative positive ion mode DESI-MS mass spectrum from the outer layer of human lens with the peak corresponding to PE(18:1e/18:1) starred. Adapted from references 7, 50, 69 and 58.

