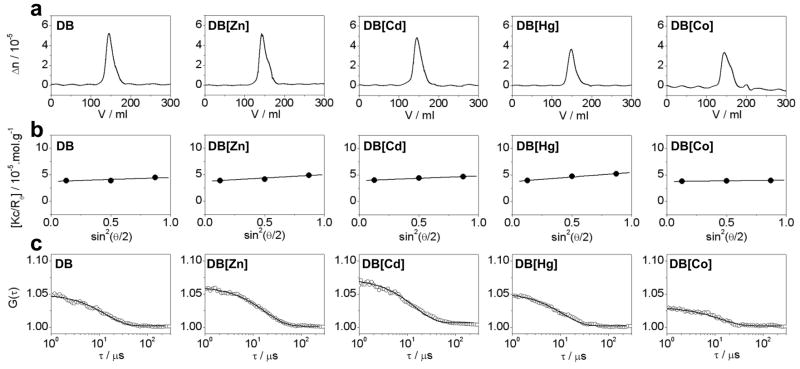
Figure 4.
Representative ALS chromatograms for the DB domain of ERα pre-treated with EDTA to strip divalent zinc ions (DB) and upon reconstitution with divalent ions of zinc (DB[Zn]), cadmium (DB[Cd]), mercury (DB[Hg]) and cobalt (DB[Co]). (a) Elution profiles as monitored by the differential refractive index (Δn) plotted as a function of elution volume (V) for the indicated species. (b) Partial Zimm plots obtained from analytical SLS measurements at a specific protein concentration for indicated species. The solid lines through the data points represent linear fits. (c) Autocorrelation function plots obtained from analytical DLS measurements at a specific protein concentration for the indicated species. The solid lines through the data points represent non-linear least squares fits to Eq [4].

