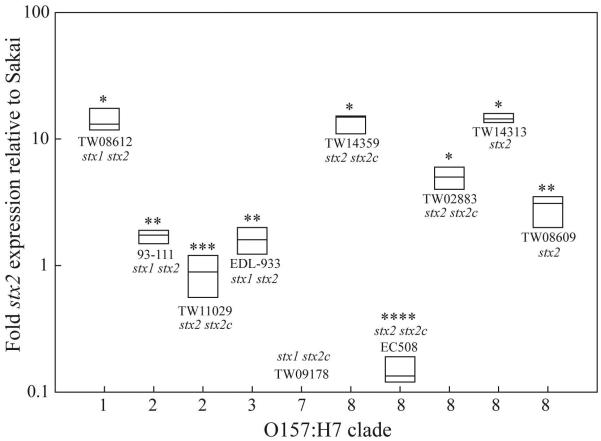
FIG. 1. Basal stx2 transcript levels.
Boxplots of mean fold-change in stx2 expression relative to strain Sakai for 10 strains representing 5 O157:H7 clades as determined by qRT-PCR. Plot boundaries represent the 25th and 75th percentiles; the median is given by the line. Plots which differ in the number of asterisks, differ significantly by Tukey’s HSD following a significant F-test (P<0.05). Strain names and stx complement are provided in proximity to each respective plot. As expected, no stx2 transcript was detectable for stx2-stx2c+ control strain TW09178.

