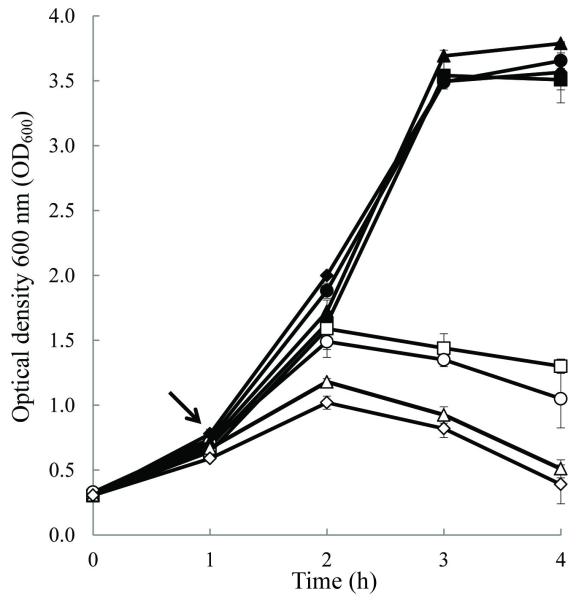
FIG. 4. Bacteriophage induction during growth with ciprofloxacin.
Plot of optical density at 600 nm (OD600) as a function of time for uninduced control (filled plots) and ½X MIC ciprofloxacin induced (empty plots) cultures. Arrow indicates point of ciprofloxacin addition. Strains included Sakai (squares), EDL933 (circles), TW02883 (diamonds), and TW14359 (triangles). Measurements represent the mean (N=3) OD600 and error bars indicate standard deviation.

