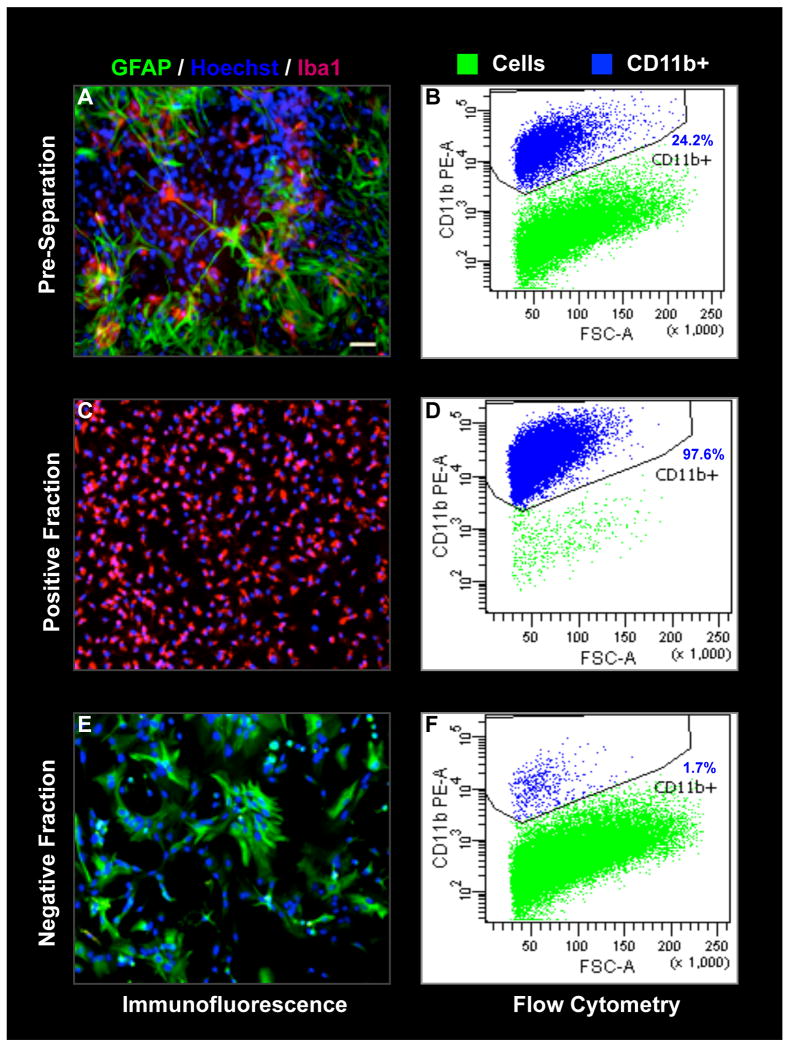
Fig. 2. Analysis of microglial population before and after magnetic separation.
The proportion of microglia was determined quantitatively by flow cytometry with direct CD11b-PE labeling and also confirmed by iba1/GFAP/Hoechst immunofluorescence. Before separation, the mixed glial population contained around 26% CD11b+ microglia (B,A). After magnetic separation, the positive fraction contained more than 97% pure microglia (D,C) while the negative fraction had less than 2% microglia with abundant GFAP-positive cells (F,E). Results from one representative separation are shown. Data for multiple separations is summarized in Table1.

