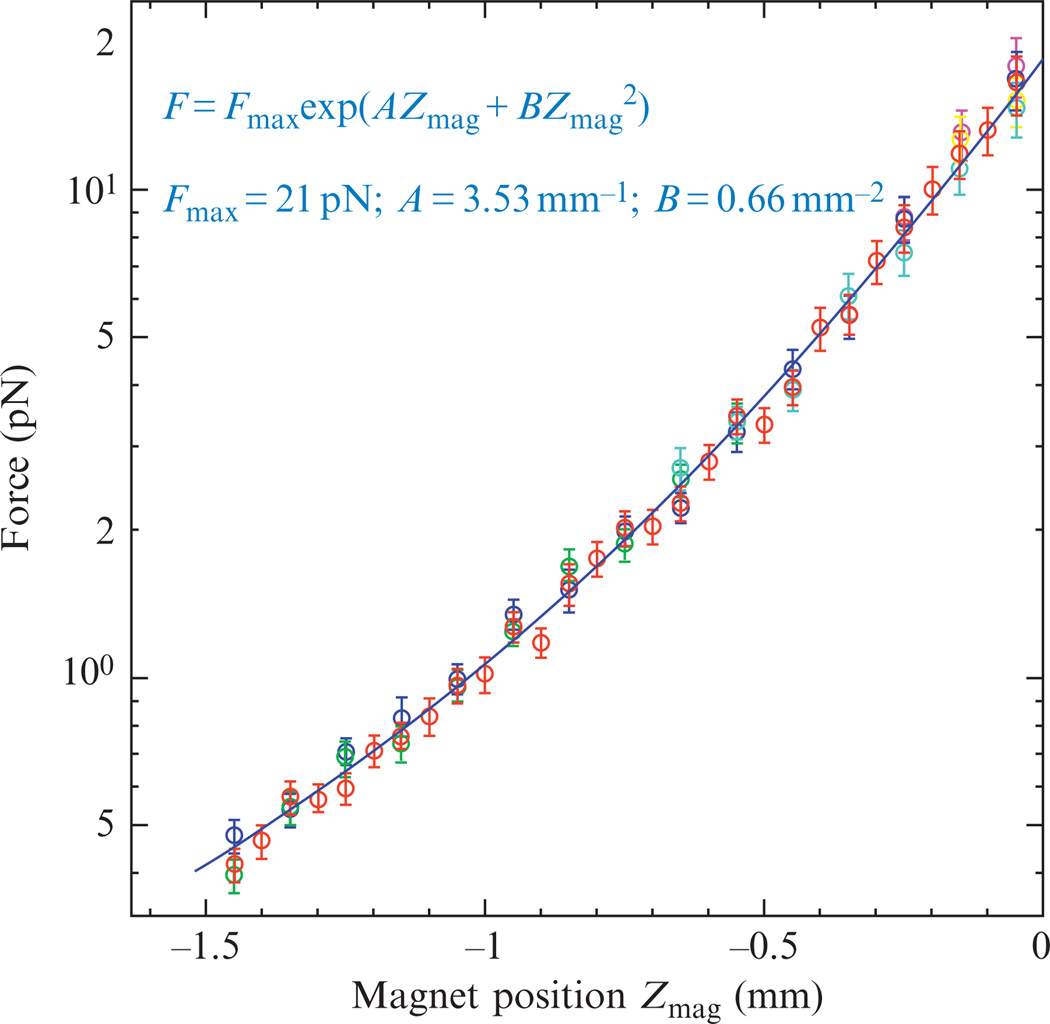
Figure 13.2.
Force calibration. Force as a function of the magnets position (Zmag) measured for several micron-sized beads (Myone Invitrogen) attached by a single λ-DNA molecule (each color corresponds to a separate bead). Note that the position Zmag is measured with respect to the sample chamber (e.g., Zmag = 0 when the magnets touch the upper surface of the chamber and when the magnets are 1 mm above the chamber Zmag = −1). The blue line corresponds to a fit of the data to the function , which yields Fmax = 21 pN, A = 3.53 mm−1 and B = 0.66 mm−2. This curve can be used to estimate the force on the bead at a known position of the magnets.

