Figure 4.
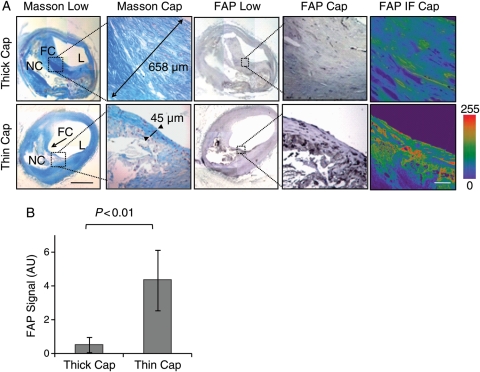
Fibroblast activation protein expression is enhanced in thin-cap vs. thick-cap human coronary fibroatheromata. (A) Masson staining shows collagen-rich thick (658 µm) vs. thin (45 µm) fibrous caps (L, lumen; FC, fibrous cap; NC, necrotic core; bar = 1 mm). Fibroblast activation protein immunohistochemistry and immunofluorescence (intensity scale; bar = 50 µm) shows fibroblast activation protein expression in representative thin vs. thick caps. Dotted boxes indicate regions of interest in adjacent sections at high magnification. (B) The graph reveals a significant increase in fibroblast activation protein expression in thin vs. thick fibrous caps (n = 12 each).

