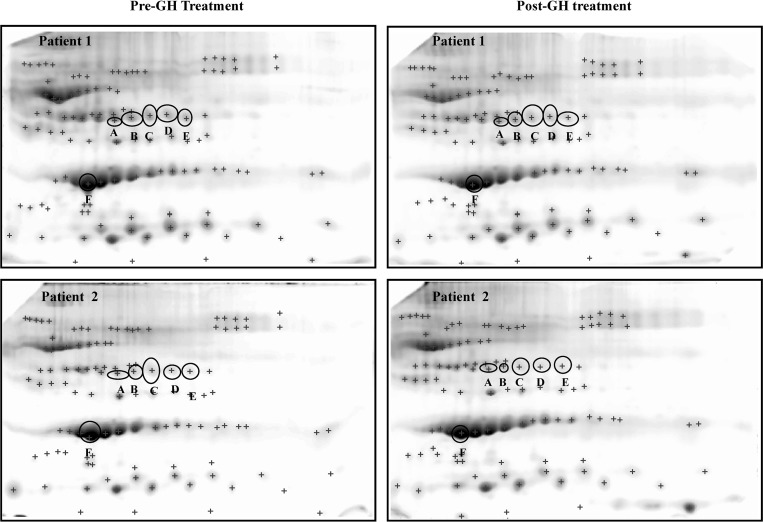
Fig. 2.
Representative 2DE gels showing their spot patterns. A total of 111 spots were analyzed [plus (+) signs]. Images belong to two different patients (see labels) and correspond to the pre- and post-GH substitution treatment. Six protein spots displayed significant changes after the treatment (labeled A–F).

