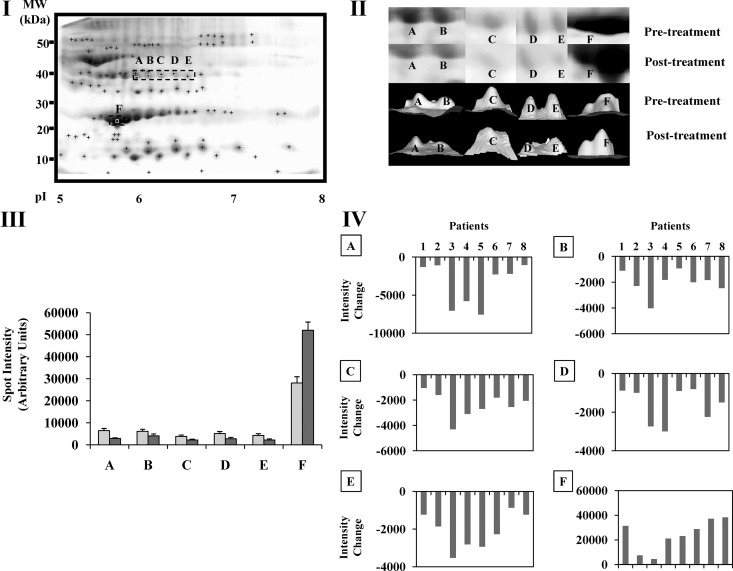
Fig. 3.
I, Representative 2DE serum gel showing the five protein spots identified by MS as haptoglobin isoforms (labeled A–E and squared by a dotted outline) and apoA-I (labeled F and squared by a dotted outline). II, Three-dimensional (3D) view of protein spots A–F displaying intensities before (upper panel) and after treatment (lower panel) for each protein spot. Images were generated using PDQuest software version 8.0 (Bio-Rad Laboratories). Upper and lower images belong to the same patient. III, Intensity values (mean ± sem) before (gray) and after GH treatment (dark gray) for protein spots A–F. IV, Spot intensity changes (intensity after GH treatment minus intensity before GH treatment) for each individual subject (1–8) for each of the six spots (A–F). Letters above each panel correspond to the protein spot shown in each graph.

