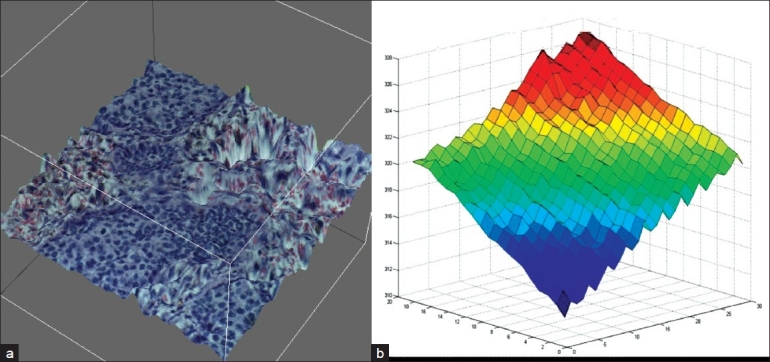
Figure 1.

Tissue topography. (a) Topographical map of a typical FoV from a 5 μm thick tissue section illustrating variations in the z-plane of best focus. Multiple z-planes were acquired and composited to reconstruct the topography. (b) Graphical representation of z-dimension variations per FoV across a whole slide image. Each acquired FoV was stitched together to show the variation that occurs from tile to tile in the z-dimension. A single tile can vary over 1μm in the z-dimension from a neighboring tile. Stage tilt is easily observed (red to blue) which further contributes to variations in the z-dimension across a whole tissue section.
