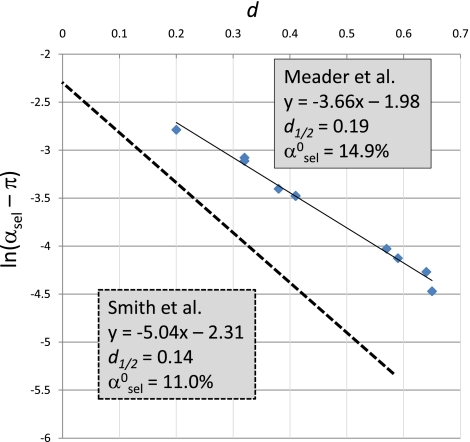
Figure 3.
The constrained noncoding fraction of the human genome (αsel − π) declines exponentially with species divergence, d. The regression line for the natural logarithm of (αsel − π) against d for the Smith et al. (2004) study is shown by the broken line. Data points for the Meader et al. (2010) study are shown (blue diamonds), together with their regression line (solid line). The equations for these lines are presented, together with the inferred values of α0sel and d1/2. Meader et al. (2010) data were taken to be the midpoint between lower and upper bound estimates. Divergence values in the Smith et al. (2004) and Meader et al. (2010) studies were estimated from full alignments and from synonymous sites, respectively. As elsewhere in this review, αsel is defined relative to the size of the human genome, rather than to the sizes of different animal genomes.

