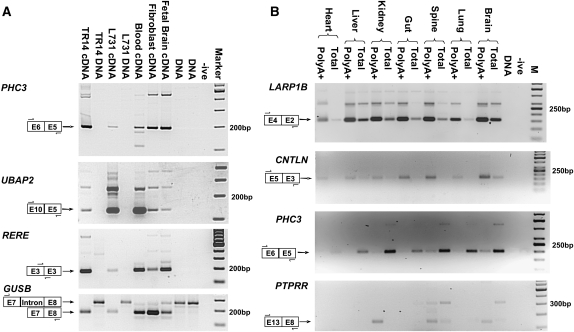
Figure 1.
Expression of human PTES transcripts. PTES structures, approximate primer location, and expected amplicon size are indicated for each panel. (A) Validation of human PTES transcripts. Amplification of products from the PHC3, UBAP2, and RERE genes are shown. TR14 is a neuroblastoma cell line (Rupniak et al. 1984), and L731 is one of the templates used for HTG sequencing (see Methods). GUSB is a control for template quality (see text). (-ive) No template negative control; (Marker) 100-bp ladder. (B) Polyadenylation and tissue specificity of transcripts. Amplification products from the LARP1B, CNTLN, PHC3, and PTPRR genes are shown. All templates are cDNAs generated from total or PolyA+ RNAs extracted from human fetal tissues (see Methods). (-ive) No template negative control; (M) 50-bp ladder (panels 1–3) and 100-bp ladder (panel 4).

