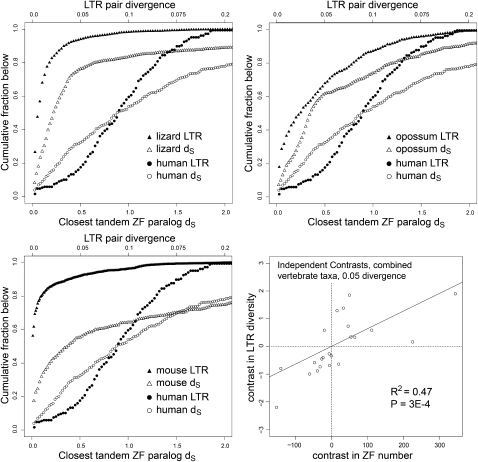
Figure 2.
ZF gene duplicate and LTR divergence time courses. Three panels show cumulative histograms of LTR nucleotide divergence and closest ZF paralog dS for the indicated species. The axes have been scaled to best display the full curve for both data sets. The human data are included in all three panels for comparison. The fourth panel (lower right) shows statistical analysis at or below one divergence point (0.05 LTR divergence/0.05 paralog dS) for all species combined after correction by independent contrasts (see Supplemental Table S3). The line is the linear least-squares best fit forced to go through the origin and its associated R2 and P-value.

