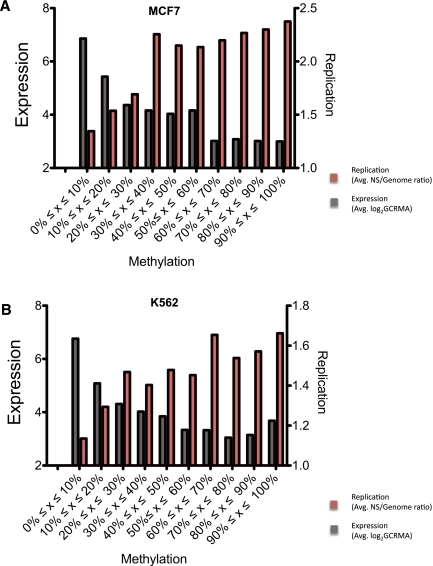
Figure 6.
Effect of CpG methylation on the frequency of replication initiation events and gene expression. The level of CpG methylation for MCF7 cells (A) and K562 cells (B) is plotted against gene expression levels (log2 GCRMA, gray histograms) and replication enrichment ratio (nascent strands vs. genomic control, red histograms). For box plots of the data , please see Supplemental Information.

