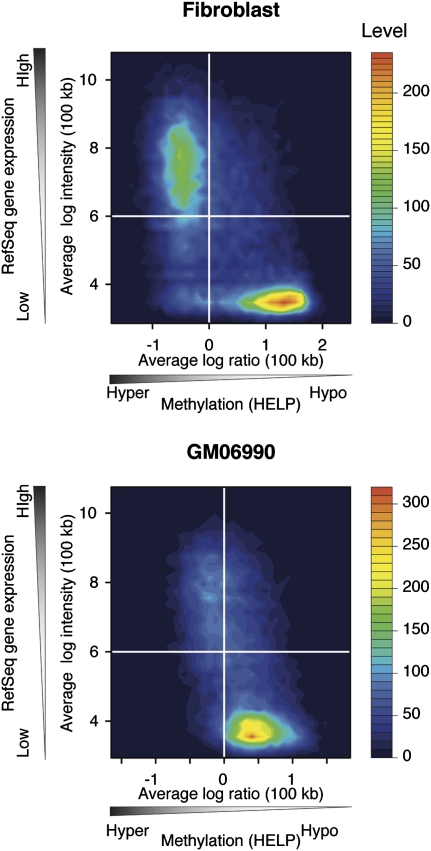
Figure 3.
Broad correlation exists between DNA hypermethylation and actively transcribed gene regions. Extending the analysis of Supplemental Figure 3 to a 100-kb sliding window representation continues to show the relationship between increased gene expression and hypermethylation of DNA. A two-dimensional histogram of the averaged HpaII/MspI log2 ratio in 100-kb windows and averaged signal intensities of the genes are represented by filled contour plots.

