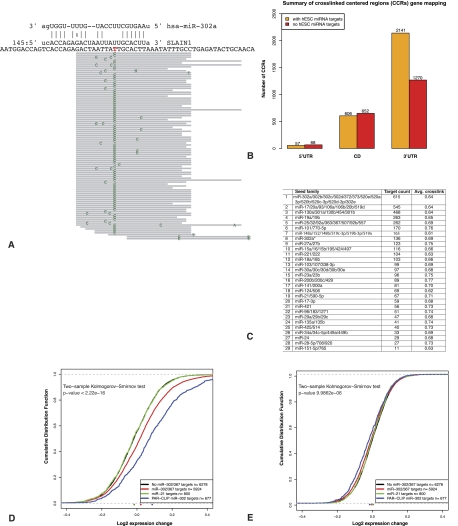
Figure 2.
Experimental and computational identification of miR-302/367 targets in hESCs. (A) PAR-CLIP data provide precise location of the AGO2-binding site with hallmark T-to-C mutation at the cross-linked site. This position is typically upstream of the complement microRNA seed sequence shown in the novel SLAIN1 target site identified in this study. The top panel represents an miR-302a predicted target site (at position 145 in the 3′ UTR), and the bottom panel depicts the mapped sequence reads and mismatched positions in green. (B) Summary of the genomic mapping of the CCRs identified by PAR-CLIP. Of the total 7527 CCRs, 4794 (>63%) were mapped to annotated genes. Orange bars indicate the number of CCRs with predicted target sites for one or more of the endogenously expressed (top 29) seed sequences in hESCs, whereas red bars indicate the number of CCRs with no predicted sites for these microRNAs. (C) A summary of the number of CCRs targeted by each of the top 29 hESC-expressed microRNA seed families. Average cross-link is the average fraction of reads in the CCRs with T-to-C mutations (see also Supplemental File S1; Supplemental Table S2). (D) Inhibition of miR-302/367 results in up-regulation of their predicted targets. The cumulative distribution of the log2 expression change of miR-302/367 targets is significantly increased after miR-302/367 inhibition relative to the background set that lacks miR-302/367 predicted targets. Similarly, the miR-302/367 targeted genes identified in the PAR-CLIP experiments are also significantly up-regulated following miR-302/367 inhibition. In contrast, targets of miR-21, another highly expressed microRNA in hESCs, do not undergo a significant change in expression, indicating specific inhibition of miR-302/367. (E) In contrast to inhibition, ectopic expression of miR-302/367 results in only a minor decrease in the expression of their targets.

