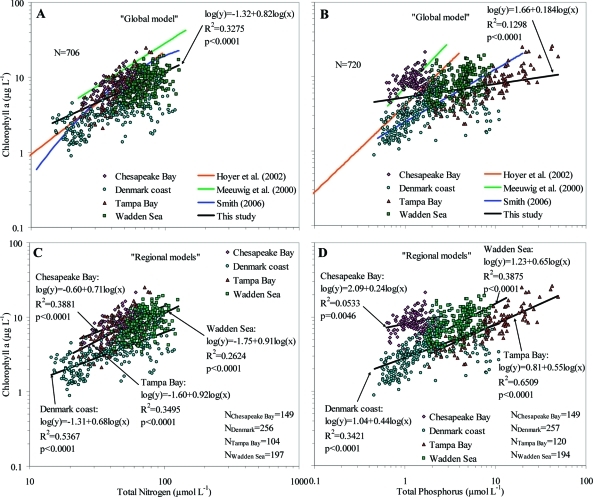
Figure 1.
Relationships between annual mean Chla and annual mean TN (left panel, A and C) and TP (right panel, B and D) concentrations for all data combined (“Global model”, A and B) and for the four regions separately (“Regional models”, C and D). Solid black lines show the fitted log–log regression equations from this study, with associated statistics listed in the plots, and the “Global model” is compared to relationships (A and B) developed elsewhere (Florida coast,(12) Finnish estuaries,(20) global(13)).

