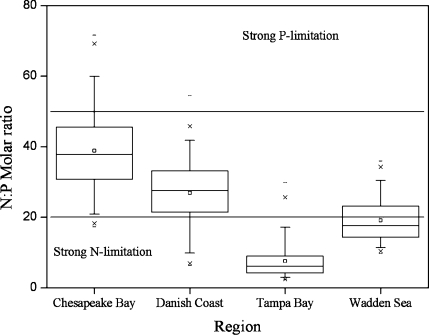
Figure 2.
Box and whiskers plot of the TN:TP molar ratio for the four regions compared to thresholds for N deficient (TN:TP < 20) and P deficient (TN:TP > 50) phytoplankton growth reported by Guildford and Hecky.(11) Boxes show lower and upper quartiles with median (line) and mean (square) inside the box. Whiskers mark the 95% confidence intervals, crosses are the 1st and 99th percentiles, and dash symbols show minimum and maximum values.

