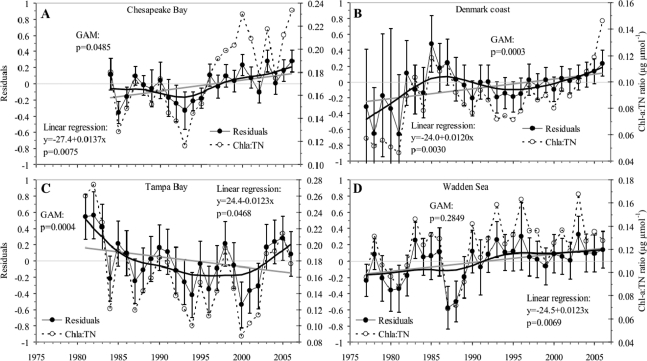
Figure 5.
Trends in residuals (annual means with 95% confidence interval of the mean value) from region-specific regressions (Figure 1C) between log(Chla) and log(TN) investigated by linear regression and a nonparametric GAM with statistics listed. For comparison the ratio between annual mean Chla and TN is also shown.

