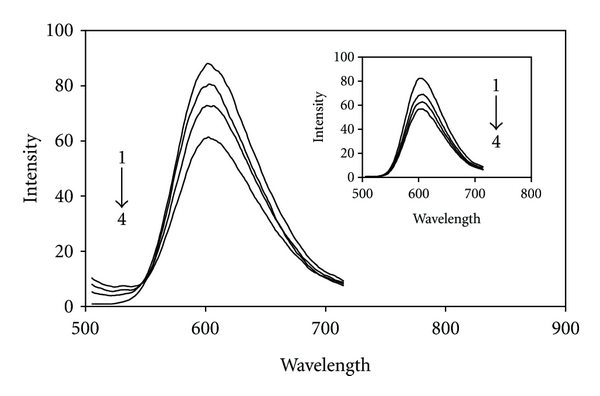
Figure 10.

Fluorescence emission spectra of interacted EB-DNA in the absence (1) and presence of different concentrations of [Pt(bpy)(Oct-dtc)]NO3 and the inset for [Pd(bpy)(Oct-dtc)]NO3: 33 μM (2), 71 μΜ (3), and 111 μM (4) and 12 μM (2), 35 μM (3), and 55 μM (4), respectively, at 300 K.
